
Every study in Panoplai is organized into three steps, shown at the top of the study: Build, Get Data and Results. Click any step to move between them.
Build
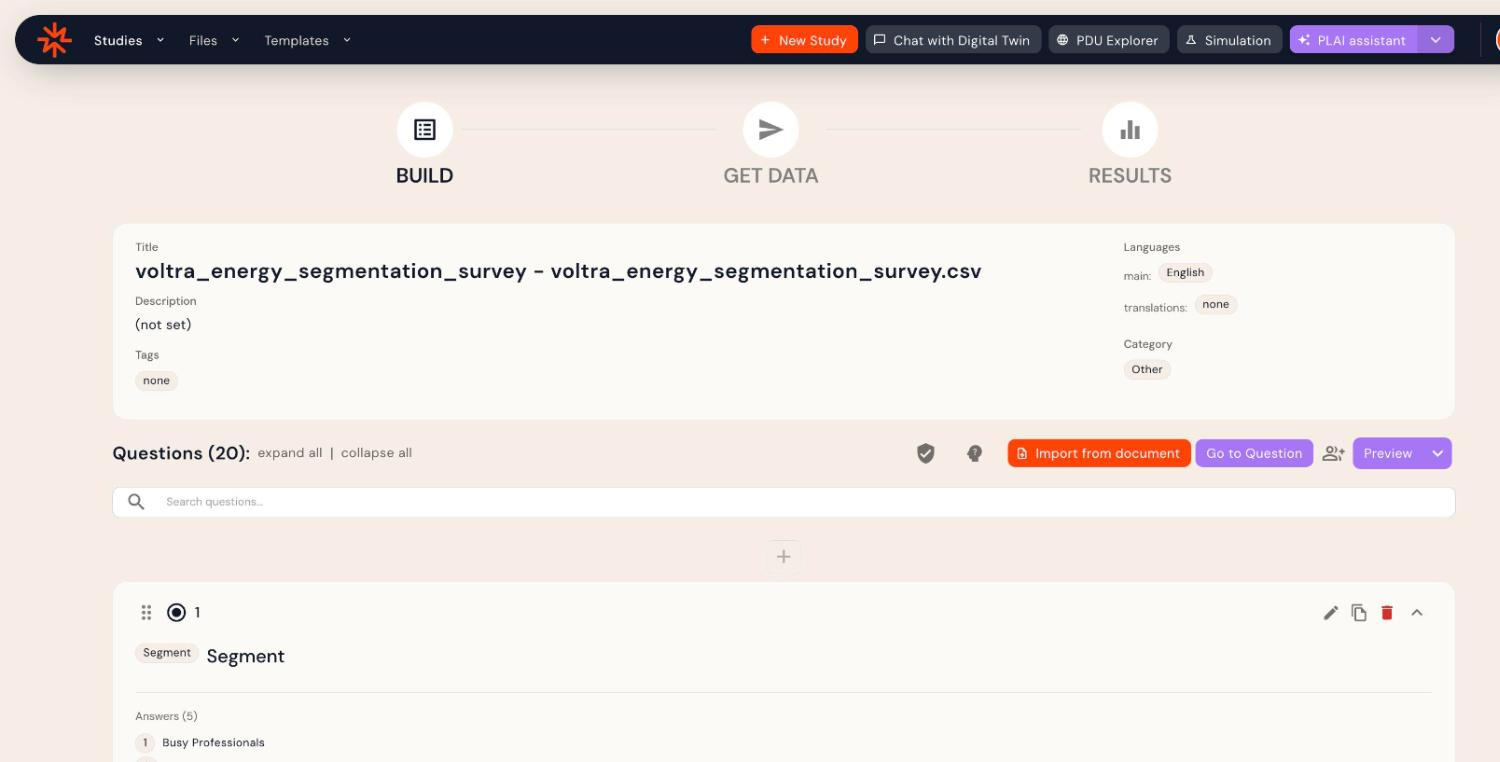
This is the survey builder. Here you can:
- See and edit the study details: title, description, tags, languages and category
- Add, edit, duplicate, delete and reorder questions (changes save automatically)
- Search questions, expand all / collapse all, or use Go to Question
- Use Import from document to add questions from a questionnaire file
- Turn on the AI Moderator (head icon) and Terminate high risk respondents (shield icon) settings
- Share the study (person icon) and Preview it
See New Survey Builder.
Get Data
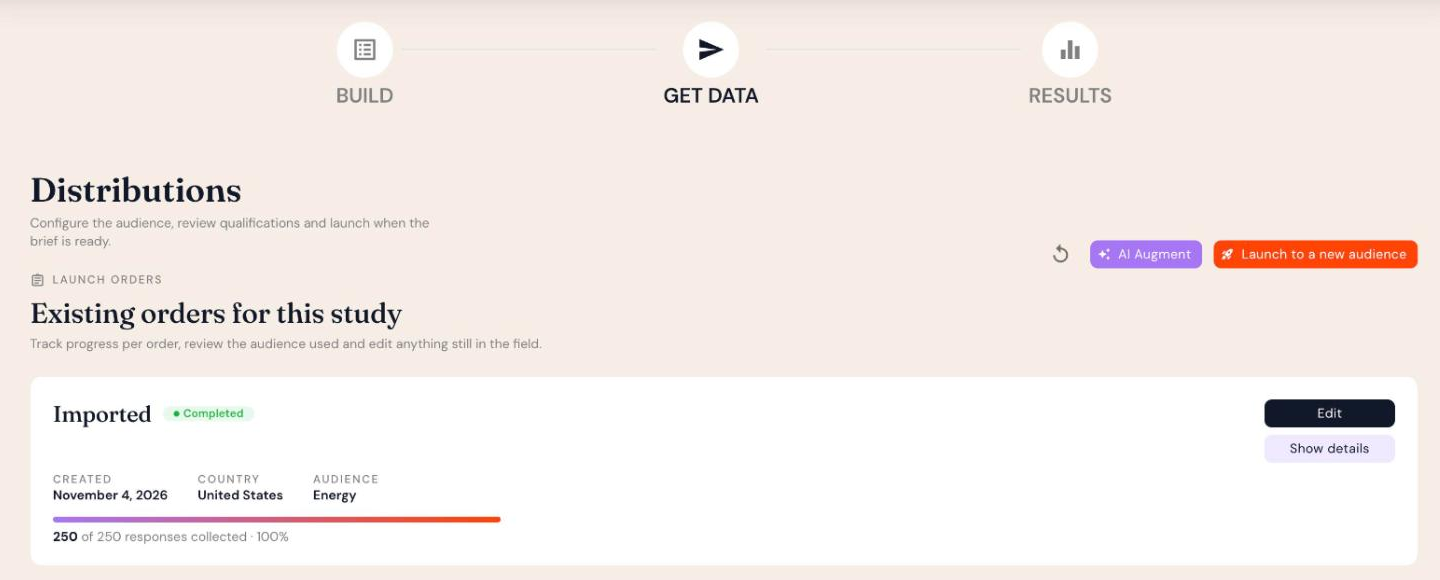
The Distributions page is where you collect responses. It lists Existing orders for this study, each with its audience, country and a progress bar of responses collected. From here you can:
- Launch to a new audience: field the study to a Panoplai audience or your own participants. See How do I launch my study?
- AI Augment: add synthetic responses or questions modeled on your data. See AI Enrich.
- Edit or Show details on an existing order
Results
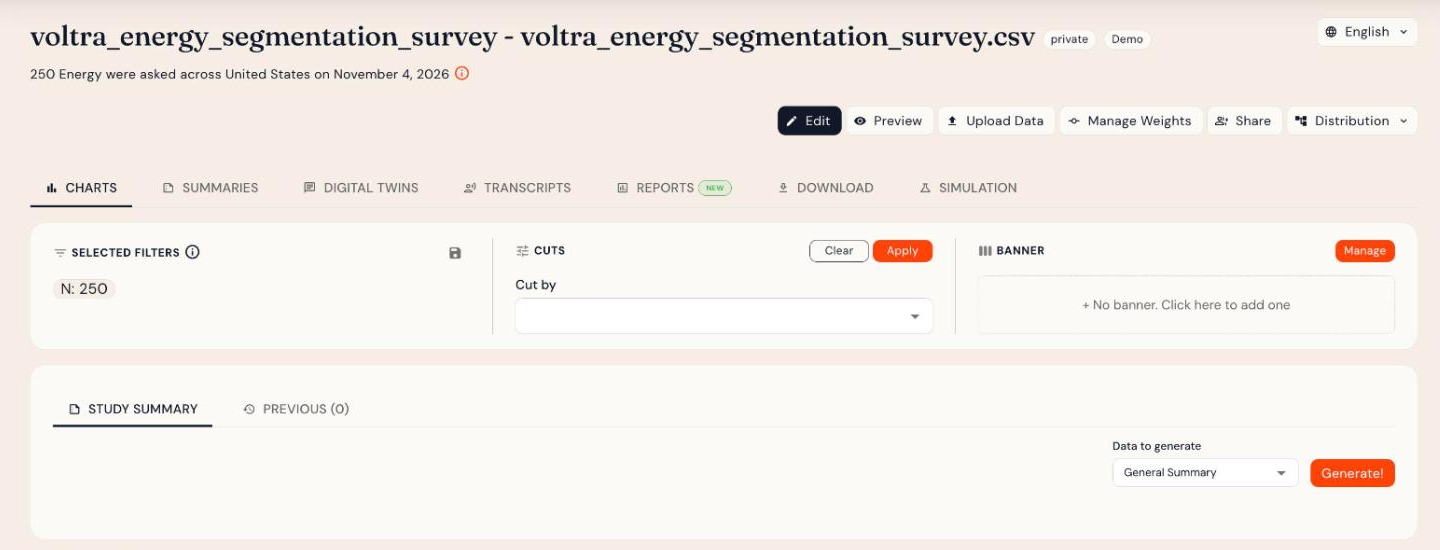
Your analysis dashboard. The header shows the study's sample, audiences and field dates, plus Edit, Preview, Upload Data, Manage Weights, Share and Distribution. Use the language selector to view results in another language. The tabs are:
- Charts: question-by-question results, with filters, cuts and banners
- Summaries: AI-generated study and question summaries
- Digital Twins: chat with your data or with an individual respondent
- Transcripts: each respondent's answers, including AI-moderated follow-ups
- Reports: build shareable custom reports
- Download: export presentations, crosstabs and raw data
- Simulation: predict how an audience would answer new questions
The panel on the right side of the Results page gives quick access to Questions, Demos (demographics) and Filters.