How To Group:
-
In the study, click Edit to navigate to the survey builder.
-
Find the question with responses you're looking to group.
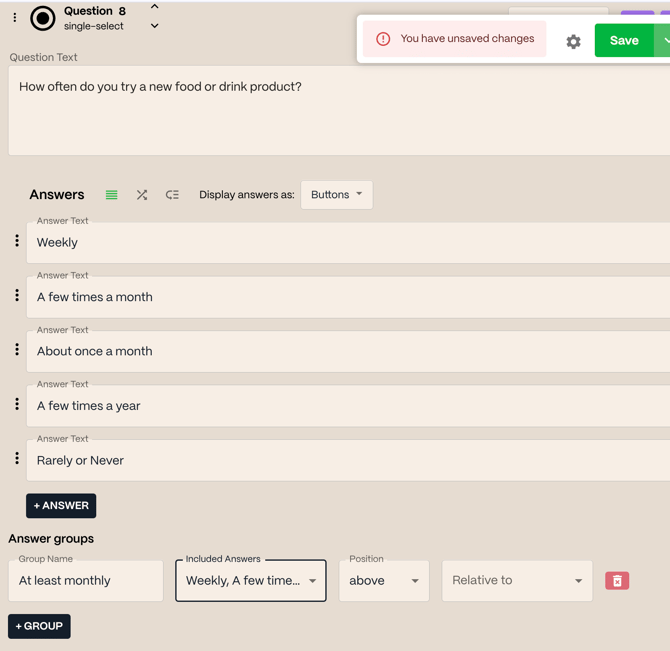
- Scroll to the bottom of the question and select +Group.
- Fill in the required information:
-
Group Name: This is what will appear on your charts and exports (e.g., Top 2 Box or Frequent Users).
-
Included Answers: Select the response options you want to include in the group. Selected options will appear slightly darker.
- Position: Choose where this new group should appear in your chart—above or below another answer.
- Relative To: Choose the response option that will anchor the new group’s position.
-
- Click Save & navigate back to the results tab.

Why Group Response Options?
-
Top 2 Box / Bottom 2 Box in Likert scales
-
Usage frequency groupings (e.g., “Daily” + “Weekly” = Frequent Users)
-
Combining attitudes or behaviors into simplified buckets for cleaner visuals
Notes & Tips
-
You can group any number of response options—just make sure they logically go together.
-
Grouped responses will appear as a new line in your results with the label you’ve assigned.
-
You can reorder or edit groups anytime from the same survey builder section.